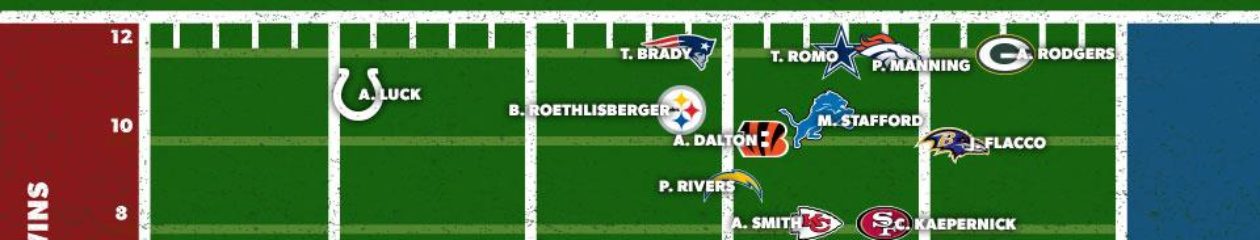
Understanding how college statistics of quarterbacks translate to NFL success, is very important to understanding the draft day value of quarterbacks. The first chart below visualizes the COLLEGE completion percentages of Super Bowl winning quarterbacks like P. Manning, Aikman, Rodgers, E Manning, Roethlisberger, Brees, Elway and Brady. They are represented as the BLUE histogram. The orange histogram represents the COLLEGE completion percentages of famous high round draft picks QB busts like Young, Harrington, Quinn, Russel, Ponder, Carter and Plummer.
Blue = QB SB winners
Orange = QB Busts
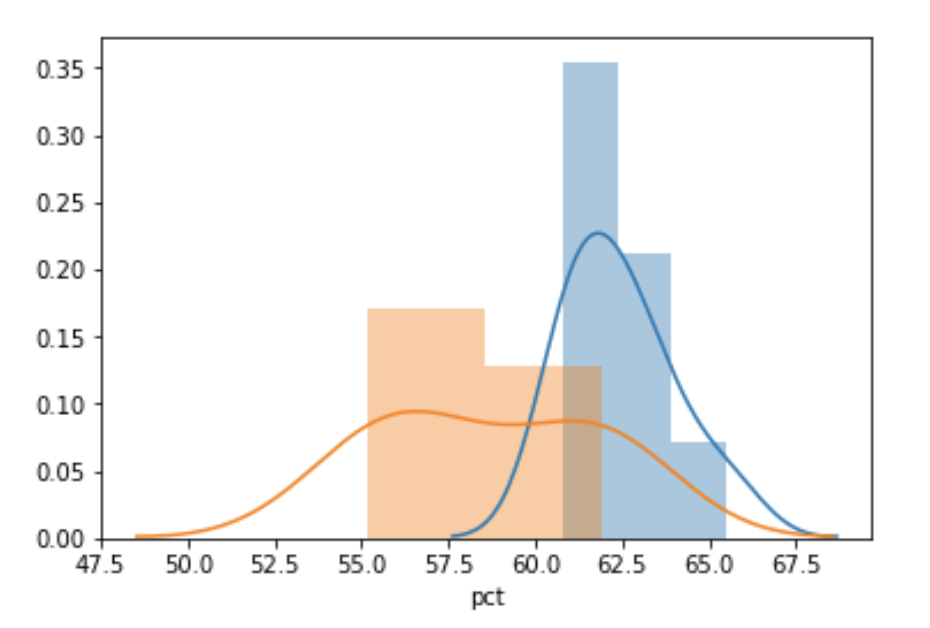
Looking at the histograms, it is apparent that the Super Bowl winners’ college completion percentage is clearly shifted to the right which indicates that this is a good indicator that college completion pct is important and should be above 60%.
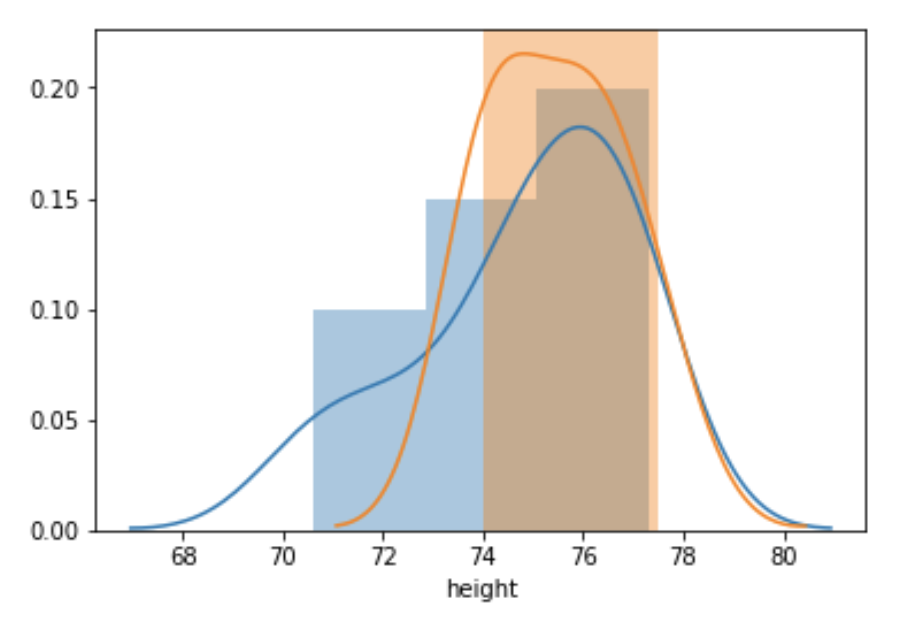
In comparison, let’s look at height as a predictor – the histograms below represent the height of the same QBs and it is apparent for the histogram with these Abs height was not predictive like college completion percentage.
Now lets look at the ratio of interceptions to touchdowns – clearly the sweet spot is around 40% and trying to stay less than 57% would be a good goal.

Interceptions / Touchdowns
The final histogram below compares the rush attempts per college game. From this chart, Super Bowl winning quarterbacks tend not to be runners whether by choice or by chase.

Rush Attempts per Game
We think the above charts provide great insight into how college statistics coupled with machine learning can help predict NFL success on draft day.