If an NFL team could predict, with a high probability, that a quarterback would have a greater than 55% winning percentage by his third season, using only college statistics, would that be something valuable to most NFL teams during the NFL draft?
We think the answer is absolutely a yes and the good news is we have developed such a system using machine learning.
And you read that right, our system ONLY USES COLLEGE STATS to predict the NFL performance of these quarterbacks.
Below is our analysis using our Machine Learning NFL Draft Quarterbacks Prediction System
For our analysis, we started with a list of active NFL quarterbacks for the 2016-2017 NFL season. We then limited the list to only those quarterbacks with 13 or more career starts. Using this list, we ran each player through our machine learning NFL quarterback draft system. Here is the list.
| Player | GS | W | L | T | Win Pct |
| Tom Brady | 234 | 182 | 52 | 0 | 0.778 |
| Drew Brees | 231 | 131 | 100 | 0 | 0.567 |
| Eli Manning | 198 | 107 | 91 | 0 | 0.54 |
| Ben Roethlisberger | 183 | 123 | 60 | 0 | 0.672 |
| Philip Rivers | 175 | 97 | 78 | 0 | 0.554 |
| Carson Palmer | 173 | 88 | 84 | 1 | 0.512 |
| Matt Ryan | 141 | 84 | 57 | 0 | 0.596 |
| Jay Cutler | 139 | 68 | 71 | 0 | 0.489 |
| Joe Flacco | 137 | 83 | 54 | 0 | 0.606 |
| Alex Smith | 135 | 78 | 56 | 1 | 0.581 |
| Aaron Rodgers | 134 | 89 | 45 | 0 | 0.664 |
| Tony Romo | 127 | 78 | 49 | 0 | 0.614 |
| Ryan Fitzpatrick | 115 | 45 | 69 | 1 | 0.396 |
| Matthew Stafford | 108 | 51 | 57 | 0 | 0.472 |
| Matt Schaub | 92 | 47 | 45 | 0 | 0.511 |
| Andy Dalton | 91 | 54 | 35 | 2 | 0.604 |
| Cam Newton | 91 | 51 | 39 | 1 | 0.566 |
| Russell Wilson | 79 | 55 | 23 | 1 | 0.703 |
| Matt Cassel | 79 | 35 | 44 | 0 | 0.443 |
| Ryan Tannehill | 77 | 37 | 40 | 0 | 0.481 |
| Sam Bradford | 77 | 31 | 45 | 1 | 0.409 |
| Mark Sanchez | 72 | 37 | 35 | 0 | 0.514 |
| Andrew Luck | 69 | 42 | 27 | 0 | 0.609 |
| Josh McCown | 60 | 18 | 42 | 0 | 0.3 |
| Colin Kaepernick | 57 | 28 | 29 | 0 | 0.491 |
| Chad Henne | 53 | 18 | 35 | 0 | 0.34 |
| Derek Carr | 47 | 22 | 25 | 0 | 0.468 |
| Derek Anderson | 47 | 20 | 27 | 0 | 0.426 |
| Blake Bortles | 44 | 11 | 33 | 0 | 0.25 |
| Kirk Cousins | 40 | 19 | 20 | 1 | 0.487 |
| Blaine Gabbert | 40 | 9 | 31 | 0 | 0.225 |
| Robert Griffin III | 39 | 15 | 24 | 0 | 0.385 |
| Nick Foles | 36 | 20 | 16 | 0 | 0.556 |
| Christian Ponder | 36 | 14 | 21 | 1 | 0.403 |
| Shaun Hill | 35 | 17 | 18 | 0 | 0.486 |
| Brian Hoyer | 31 | 16 | 15 | 0 | 0.516 |
| Jameis Winston | 31 | 14 | 17 | 0 | 0.452 |
| Geno Smith | 30 | 12 | 18 | 0 | 0.4 |
| Teddy Bridgewater | 28 | 17 | 11 | 0 | 0.607 |
| Tyrod Taylor | 28 | 14 | 14 | 0 | 0.5 |
| Matt Moore | 27 | 15 | 12 | 0 | 0.556 |
| Marcus Mariota | 27 | 11 | 16 | 0 | 0.407 |
| Colt McCoy | 25 | 7 | 18 | 0 | 0.28 |
| Brandon Weeden | 25 | 6 | 19 | 0 | 0.24 |
| Case Keenum | 24 | 9 | 15 | 0 | 0.375 |
| Brock Osweiler | 21 | 13 | 8 | 0 | 0.619 |
| Kellen Clemens | 21 | 8 | 13 | 0 | 0.381 |
| Bruce Gradkowski | 20 | 6 | 14 | 0 | 0.3 |
| Mike Glennon | 18 | 5 | 13 | 0 | 0.278 |
| E.J. Manuel | 16 | 6 | 10 | 0 | 0.375 |
| Dak Prescott | 15 | 13 | 2 | 0 | 0.867 |
| Carson Wentz | 15 | 6 | 9 | 0 | 0.4 |
| Drew Stanton | 13 | 8 | 5 | 0 | 0.615 |
| Trevor Siemian | 13 | 7 | 6 | 0 | 0.538 |
There were a total of 54 NFL Quarterbacks active in 2016-2017 that had thirteen or more starts. Of those, 36 would have been “yes” drafts by our Machine Learning system and 18 would have been no drafts.
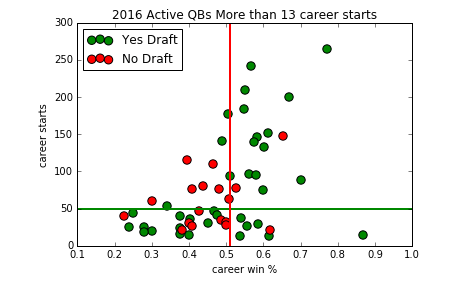
To better visualize how the “yes” drafts quarterbacks and no draft quarterbacks compare, we graphed them in the chart at the bottom of this page. The no drafts are RED and the yes drafts are GREEN.
If you look at the chart, plotted along with the red and green dots, you will see a red vertical line. This line represents the 51% win mark. Any player to the right has 51% or greater career wins.
The horizontal green line represents 50 starts which is right at 3 complete regular season. So above the green line is 50 or more starts
We think the most compelling relationship exposed by this graph is that only 4 of the 18 no draft players have more than 55% of the wins regardless of how far along they are in there career. This means that if you drafted a Quarterback that our system predicted was a no draft, you would have only a 22% chance of drafting a quarterback that would have a 55% or better win percent at any time in his career. Conversely, that is an 78% chance that you would draft a quarterback with a less than 55% win percent probability. We should note, that the one red dot in the top right quadrant is Aaron Rodgers and he came out of college after 2 years – so our system did not have enough data to rank him and defaulted to a No draft. Removing Rodgers, the no drafts win percentages are very pathetic.
It should be noted that all of the NO draft (red dot) quarterbacks were in fact drafted by a team and were in fact active at some point in 2016 – 2017.
Now looking at the “yes” drafts on the chart, there are 21 of 36 that have a winning percentage above 55% which is a more than a 58% probability. So by avoiding the “no” drafts and sticking with the “yes” drafts, an NFL team would have over a 58% probability of choosing a quarterback that would have a at least a 55% win percentage.
What is really interesting is looking at the chart where all the dots are above the 50 starts green line, you can see there is a clear dichotomy here between the red and green dots.
Here is the breakdown once the “yes” draft quarterbacks and the no draft quarterbacks reach 50 starts. There are 17 quarterbacks from the list that reached 50 starts of those, 15 had win percentages of at least 55% – that is a whopping 88%.
There are 9 “no” draft quarterbacks that achieved 50 starts, of those 9, only 3 had a winning percentage of at least 55%. That means that only 33% of the no draft predicted quarterbacks achieved a 55% or higher winning percentage.
If an NFL team wants to draft a college quarterback in the NFL draft that is more likely to have a 55% winning percentage, they should ask us to help them using our Machine Learning NFL Draft Winning Quarterbacks Prediction System